
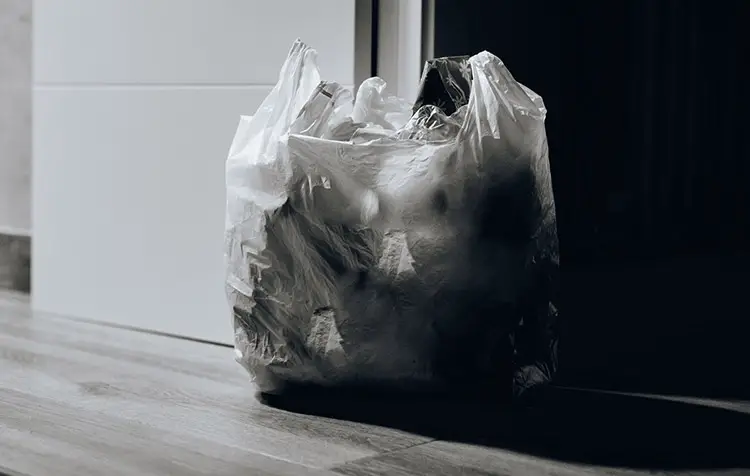
You search Plastic waste Statistics, facts, figures and studies? Then you've come to the right place. By 2050, there could be more plastic swimming in the sea than fish. In Germany, we use around 320,000 disposable coffee cups every hour. Frightening figures, aren't they? That's why the results from plastic studies, as well as the statistics and facts on global plastic waste, are crucial to sensitize people to the fact that we have a massive problem with our plastic waste. We simply make too much of it for the fact that it is not biodegradable. As we have not yet mastered the correct handling of the material, a significant proportion of our plastic waste ends up in the waste bin. Plastic waste in the environment.
In this article, I would like to give you an understanding of the most important plastic waste facts, figures and statistics from scientific studies. From consumption data and environmental impact figures to alarming forecasts for the future. Let's go!
Here is another short Table of contents about this statistics article:
Notice: Even if many of the facts mentioned are based on the underlying studies, you will find all the exact sources again in the bibliography. Please share this article if you use statistics and facts from it. You can use the address of this page or the following citation. Thank you for your support!
Schulz, C.; CareElite.de (2019): Plastic waste statistics, facts, figures & studies 2018/2019. https://www.careelite.de/plastik-muell-fakten
Consumption data on plastic waste
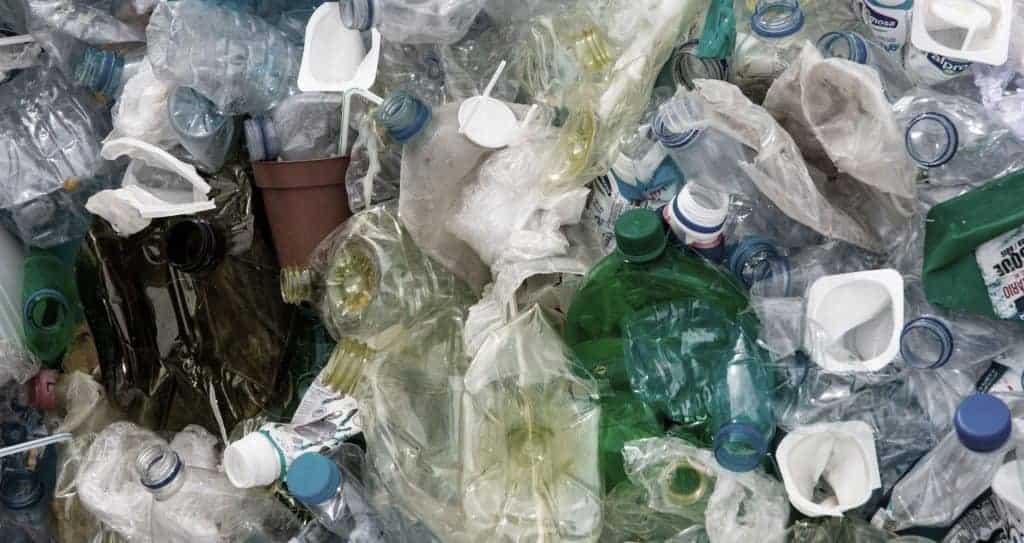
These facts about plastic waste consumption and the types of plastic waste should give you an idea of the consumer behavior of our (global) society within a few seconds:
How much plastic waste do we leave behind?
- In 2016, Germans generated around 38 kilograms of plastic packaging waste per capita. Only in Luxembourg (50.5), Ireland (46.2) and Estonia (42.2) is consumption in Europe even higher.₁
- On a global average, each person produces 0.74 kilograms of waste per day. The amount increases with increasing prosperity.₂
- A total of 11.8 million tons of plastic were consumed in Germany in 2016.₃
What plastic waste do we leave behind?
- Every year, 2 billion plastic bags are used in Germany.₄ This corresponds to around 24 plastic bags per capita.₅
- The average time a plastic bag is used in Germany is 25 minutes.₆
- In Germany, around 320,000 Coffee2Go cups are consumed every hour. That's almost 3 billion disposable cups per year.₇
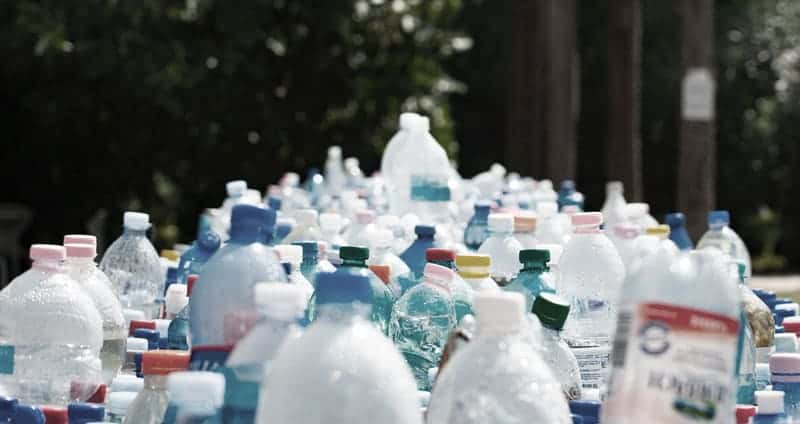
- Around one million plastic drinks bottles are sold worldwide every minute.₈
- Every year, around 36.4 billion disposable plastic straws are used worldwide.₉
- The fishing industry alone causes around 640,000 tons of plastic waste in the sea every year.₅₂
- 16 billion Coffee2Go cups are used worldwide every year.₁₀
How long do plastic goods last on average?
Different plastic products also have different average useful lives. You can find the relevant figures and statistics here. This is how long the items from the respective area last on average:
- Packaging: 0.5 years
- Consumer goods: 3 years
- Textiles: 5 years
- Electronics: 8 years
- Transportation & Traffic: 13 years
- Industrial machinery: 20 years
- Construction sector: 35 years
Notice: These plastic statistics come from the 2019 Plastic Atlas₁₁, published by the German Federation for the Environment and Nature Conservation.
Statistics on the production of plastic
Here you will find facts and figures on the production of plastics as well as on their recycling.
How much plastic is produced?
- Over 14 million tons of plastic were produced in Germany in 2017.₁₂
- By 2015, more than 8.3 billion tons of plastic waste had been generated globally.₁₃ Of this, around 9 percent was recycled, 12 percent incinerated and 79 percent landfilled or disposed of in the environment.₁₄
- Over half (56 percent) of the plastic ever produced worldwide has been produced since 2000.₁₅
- The production of Plastic required around 8 percent of global oil production in 2016.₁₆
- Around 36 percent of global plastic production results in packaging material. 14 percent is used for textiles and around 16 percent for buildings and other construction work.₁₇
- The first plastic product was launched on the market in 1950. In that year, around 1.5 million tons of plastic were produced worldwide.₁₈
- Today, 407 million tons of plastic are produced every year. Of this, 146 million tons are packaging material alone, most of which is only used once. The construction sector uses 65 million tons, 47 million tons are used for textiles. Consumer goods account for 42 million tons and transport & traffic for 27 million tons. 18 million tons are used for electronics and 3 million tons for industrial machinery.₁₉
How much plastic waste is recycled, dumped and shipped abroad?
- Of the 5.2 million tons of plastic waste generated in Germany in 2017, just 810,000 tons were recycled. This corresponds to a recycling rate of just 15.6 percent.₂₀
- Around 11 per cent of German packaging waste was exported abroad in 2016.₂₁ In 2018, this figure rose to almost 13 per cent.₂₂ 740,606 tons went to the 14 largest waste recipients from Germany alone - 132,106 tons of plastic waste were shipped to Malaysia alone.₂₃
- Of the 6.9 billion tons of plastic waste generated worldwide by 2015, around 9 percent was recycled, 12 percent incinerated and 79 percent landfilled or disposed of in the environment.₂₄
- The top exporters of plastic waste in 2018 were the USA (16.2 percent), Japan (15.3 percent), Germany (12.7 percent) and the UK (9.5 percent). The largest importers of plastic waste in the same period were Malaysia (10.7 percent), Thailand (5.5), Vietnam (5.2) and the USA (4.2).₂₅
- The average global recycling rate is 14%.₂₆
- On average, only around 7% of plastic bags are recycled in Europe.₂₇
Statistics on plastic waste in the environment and in the sea
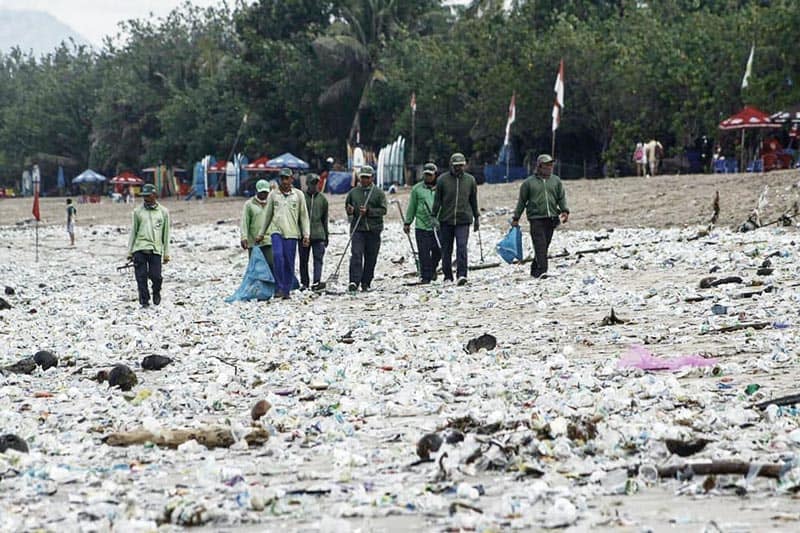
You have now learned the facts about plastic waste in countries. The following facts will make you aware of the impact of excessive plastic consumption on the environment:
How much plastic waste is in the environment?
- The total amount of plastic waste in the sea is estimated at 86 million tons. Only 0.5 percent of this is thought to be floating on the surface of the sea. 39 percent is said to be already floating in the water column or in the depths of the open sea. 33.7 percent is found on the coasts and seabed and 26.8 percent is thought to be floating in coastal waters.₂₈
- Around 10 million tons of waste end up in the sea every year. Around 75 percent of this is plastic.₂₉
- Around 82 percent of plastic waste in the sea comes from Asian countries such as Thailand, China, Indonesia, India and Vietnam.₃₀
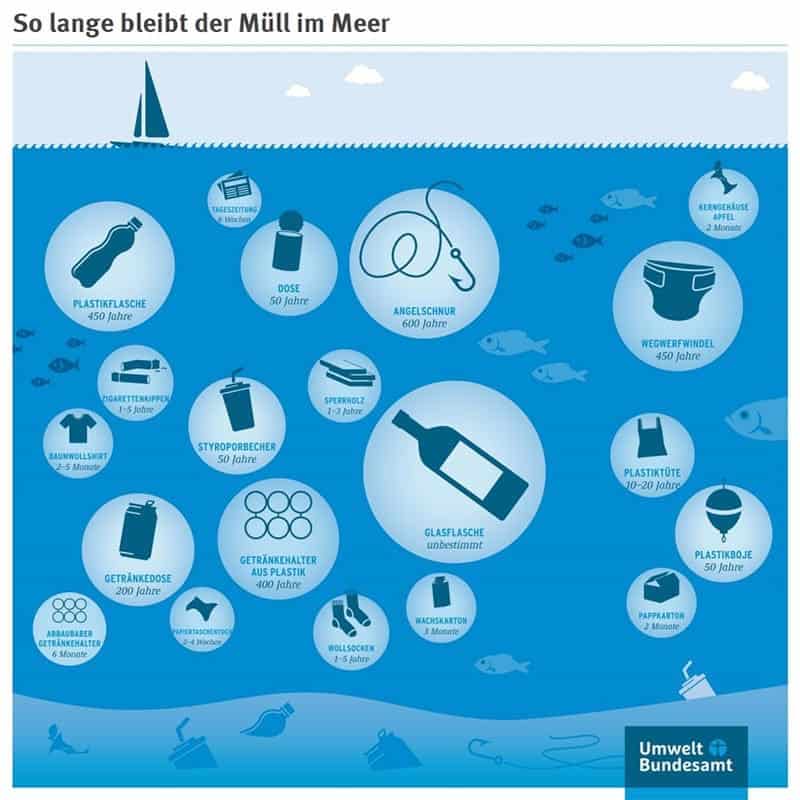
How quickly do objects decompose into microplastics?
One of the most important plastic waste statistics is knowing how long plastic waste remains in the environment. A plastic bottle in the sea takes at least 450 years to decompose. However, the plastic waste only breaks down into smaller, barely visible plastic particles. You can find out how long a tin can, a fishing line and many other things take to decompose in this graphic from the Federal Environment Agency.₃₁
How many animals die from plastic waste?
As plastic waste is not biodegradable, it causes massive damage to our natural environment. Here are the relevant plastic waste statistics on the impact on wildlife:
- Every year, around 1,000,000 seabirds and 135,000 marine mammals die as a result of contact with our plastic waste.₃₂
- Plastic waste in the sea harms more than 600 marine creatures.₃₃
- At least 15 percent of all species are endangered by ingestion of or strangulation in plastic parts.₃₄
- A fulmar has an average of 34 plastic pieces in its stomach, which weigh 0.31 grams.₃₅
What statistics are available on the large waste swirls?
Worldwide there are at least 5 huge Plastic waste swirl. The ocean currents ensure that waste from all parts of the world collects and circulates there. You can find statistics on this here:
- The Great Pacific Garbage Patch is 1.6 million km² in size. For comparison: that is about three times the area of France and 4.5 times the area of Germany.₃₆
- The Great Pacific Garbage Patch contains around 1.8 trillion pieces of plastic, weighing around 80,000 tons.₃₇
- Fishing nets left in the sea make up 46% of the Great Pacific Garbage Patch.₅₃
- 92% of the 1.8 trillion plastic particles in the Great Pacific Garbage Patch originated from larger pieces of plastic in the ocean.₃₈
- On average, every person in the world is responsible for 250 pieces of plastic in the Great Pacific Garbage Patch. This is the largest of the plastic waste whirlpools in our oceans.₃₉
Microplastic & Health Statistics

What consequences Plastic in our meals The impact of microplastics on our health is still largely unexplored.₄₀ What is clear, however, is that small microplastics have already led to inflammation, physiological disorders and higher mortality rates in marine animals.₄₁
Here you will find, among other things, facts about Microplastics in cosmetics and the plastic in our mineral water:
- More than every 3rd sunscreen tested contains Acrylates/ C10-30 Alkyl Acrylate Crosspolymer (ACS).₄₂
- At least every 5th face cream tested contains Acrylates/ C10-30 Alkyl Acrylate Crosspolymer (ACS).₄₃
- More than every 10th body scrub examined contains polyethylene (PE). But polyethylene is only part of the big microplastic problem.₄₄
- Researchers examined 38 different mineral waters and found microplastic particles in every mineral water.₄₅
- Human stool samples were also examined. On average, 20 microplastics were found per 10 grams of stool.₄₆
Helpful studies with statistics on plastic waste
Here you will find an overview of the most important and informative studies that have been carried out in Germany and globally on the plastic waste problem:
- The New Plastics Economy: Rethinking the future of plastics, ELLEN MACARTHUR FOUNDATION.
- The New Plastics Economy Rethinking the future of plastics, WORLD ECONOMIC FORUM.
- MARINE PLASTIC DEBRIS AND MICROPLASTICS - Global lessons and research to inspire action and guide policy change, UNEP, 2016.
- A EUROPEAN STRATEGY FOR PLASTICS IN A CIRCULAR ECONOMY, European Commission.
- SINGLE-USE PLASTICS - A Roadmap for Sustainability, UNEP, 2018.
- PLASTIKATLAS 2019 - Facts and figures about a world full of plastic, Heinrich Böll Foundation and German Federation for the Environment and Nature Conservation, 2nd edition, July 2019.
- Evidence that the Great Pacific Garbage Patch is rapidly accumulating plastic, Lebreton, L., Slat, B., Ferrari, F.. et al.
- Production, use, and fate of all plastics ever made, Science Advances, July 2017.
- SEAS AT RISK - for the protection and restoration of the marine environment, June 2017.
Notice: Take a look at the studies to find out even more detailed statistics, facts and figures about plastic waste. If you know of any other studies on plastic waste, please write a comment below this post.
Plastic waste figures & forecasts for the future
We keep hearing about scientific predictions as a result of our plastic mania. Here I have recorded the estimates, which should of course be treated with caution, but are by no means unrealistic:
- Researchers estimate that a further 34 billion tons of plastic will be produced by 2050.₄₇
- If plastic consumption continues at the current rate, we will have more plastic in the sea than fish by 2050. In this forecast, however, the Ellen MacArthur Foundation assumes that the fish population in 2050 will be as large as it is today. Due to human Overfishing the oceans is the time when more plastic than fish will be swimming in the sea, so it can be expected even earlier.₄₈ See also Statistics on overfishing in the oceans.
- By 2050, at least 99 percent of all seabirds will have plastic in their stomachs.₄₉
- If plastic production continues unabated, plastics alone will have generated around 56 gigatons of CO2 emissions by 2050. This means that plastics would account for between 10 and 13 percent of the remaining CO2 budget for the 1.5 degree target.₅₀
- By 2050, the production of plastic could already require 20 percent of global oil production.₅₁
Conclusion on the plastic waste figures 2018/2019
Plastic has advantages - and Plastic has disadvantages. The plastic waste statistics, figures, data and facts from various studies reveal that We are facing an incredibly big task, both in Germany and, of course, globally: We have to change our behavior and learn to deal with plastic in such a way that no living creature on this planet suffers as a result. This is because plastic has become one of the biggest environmental problems of our time developed. Learn in the article about a possible plastic free lifehow you can easily avoid plastic waste in your everyday life.
If we do nothing, we will only continue to saw at the branch we are sitting on. The plastic waste that we dispose of in the environment ends up back on our plates. It's time to rethink. By informing yourself and others about important figures on plastic waste, you are already on the right track.
Stay clean,

If you use plastic waste statistics from this post, please cite the following source. Thank you for your support!
https://www.careelite.de/plastik-muell-fakten/References:
₁ BUND (2019): Plastic Atlas 2019 - Facts and figures about a world full of plastic, 2nd edition, July 2019, p.13.
₂ BUND (2019): Plastic Atlas 2019 - Facts and figures about a world full of plastic, 2nd edition, July 2019, p.33.
₃ Federal Ministry for the Environment, Nature Conservation and Nuclear Safety (BMU): The BMU clarifies the topic of plastic recycling (26.11.2018). https://www.bmu.de/meldung/das-bmu-klaert-auf-zum-thema-plastikrecycling. [23.10.2019].
₄ Federal Environment Agency (2019): Plastic bags (as of: 12.06.2019). https://www.umweltbundesamt.de/umwelttipps-fuer-den-alltag/haushalt-wohnen/plastiktueten. [23.10.2019].
₅ Deutsche Umwelthilfe (2019): 3,700 plastic bags per minute: Deutsche Umwelthilfe supports development minister Gerd Müller's call for a ban (as of 17.05.2019). https://www.duh.de/presse/pressemitteilungen/pressemitteilung/3700-plastiktueten-pro-minute-deutsche-umwelthilfe-unterstuetzt-verbotsforderung-von-entwicklungsmin. [23.10.2019].
₆ Deutsche Umwelthilfe e.V. (DUH, 2015): Disposable plastic does not come in the bag! (as of 25.04.2015). http://www.duh.de/uploads/media/Einwegplastiktueten_Hintergrundpapier_2015_01.pdf.[23.10.2019].
₇ German Environmental Aid (2019): Problem coffee cups. https://www.duh.de/becherheld-problem. [23.10.2019].
₈,₁₄ National Geographic: 10 scary facts about plastic. https://www.nationalgeographic.de/10-erschreckende-fakten-uber-plastik. [22.10.2019].
₉ Seas at Risk (2017): for the protection and restoration of the marine environment (as at June 2017). Brussels, p.4.
₁₀ Seas at Risk (2017): for the protection and restoration of the marine environment (as at June 2017). Brussels, p.7.
₁₁,₁₅,₁₉ BUND (2019): Plastic Atlas 2019 - Facts and figures about a world full of plastic, 2nd edition, July 2019, p.15.
₁₂ BUND (2019): Plastic Atlas 2019 - Facts and figures about a world full of plastic, 2nd edition, July 2019, p.11.
₁₃ BUND (2019): Plastic Atlas 2019 - Facts and figures about a world full of plastic, 2nd edition, July 2019, p.8.
₁₆ The Guardian (2016): From oil use to ocean pollution: five facts about the plastics industry. https://www.theguardian.com/sustainable-business/2016/jan/20/from-oil-use-to-ocean-pollution-five-facts-about-the-plastics-industry. [22.10.2019].
₁₇ UNEP (2018): SINGLE-USE PLASTICS - A Roadmap for Sustainability, https://wedocs.unep.org/bitstream/handle/20.500.11822/25496/singleUsePlastic_sustainability.pdf, p.4.
₁₈ European Commission (2018): A European Strategy for Plastics in a Circular Economy. P. 6. https://ec.europa.eu/environment/circular-economy/pdf/plastics-strategy-brochure.pdf. [22.10.2019].
₂₀ BUND (2019): Plastic Atlas 2019 - Facts and figures about a world full of plastic, 2nd edition, July 2019, p.9.
₂₁ P. Große (2018): This is what happens to German waste (as of 26.11.2018). https://www.dw.com/de/das-passiert-mit-dem-deutschen-müll/a-46458099. [22.10.2019].
₂₂,₂₆ BUND (2019): Plastic Atlas 2019 - Facts and figures about a world full of plastic, 2nd edition, July 2019, p.36.
₂₃,₂₅ BUND (2019): Plastic Atlas 2019 - Facts and figures about a world full of plastic, 2nd edition, July 2019, p.39.
₂₄ National Geographic: 10 scary facts about plastic. https://www.nationalgeographic.de/10-erschreckende-fakten-uber-plastik. [22.10.2019].
₂₇ Darmstadt University of Applied Sciences: Facts and figures on plastic bags. (as of 30.05.2016). https://designoekologie.com/2016/05/30/7504. [23.10.2019].
₂₈ BUND (2019): Plastic Atlas 2019 - Facts and figures about a world full of plastic, 2nd edition, July 2019, p.29.
₂₉,₃₂ NABU - Naturschutzbund Deutschland e.V.: Plastic waste and its consequences. https://www.nabu.de/natur-und-landschaft/meere/muellkippe-meer/muellkippemeer.html. [22.10.2019].
₃₀ Ellen MacArthur Foundation: The New Plastics Economy - Rethinking the Future of Plastics & Catalysing Action, January 2016, p.32.
₃₁ Federal Environment Agency (2016): UBA-Infografik. https://twitter.com/umweltbundesamt/status/710842494473392128. [23-10.2019].
₃₃,₃₄ UNEP (2018): SINGLE-USE PLASTICS - A Roadmap for Sustainability, https://wedocs.unep.org/bitstream/handle/20.500.11822/25496/singleUsePlastic_sustainability.pdf, p.13.
₃₅ BUND (2019): Plastic Atlas 2019 - Facts and figures about a world full of plastic, 2nd edition, July 2019, p.28.
₃₆,₃₇,₃₈,₃₉ The Ocean Cleanup (2018): The Great Pacific Garbage Patch, Explained. YouTube, 22.03.2018, Web, 22.10.2019 at 14:10, in: https://www.youtube.com/watch?v=0EyaTqezSzs.
₄₀ Helmholtz Centre Potsdam - GFZ German Research Centre: Microplastics could start at the base of the food chain. https://www.eskp.de/schadstoffe/mikroplastik-koennte-an-der-basis-der-nahrungskette-ansetzen. [22.10.2019].
₄₁ Bavarian State Office for the Environment (2014): Microplastics in the environment, status colloquium, 03.07.2014, p.17.
₄₂,₄₃,₄₄₄ CodeCheck (2016): Microplastics study 2016 - CodeCheck study on microplastics in cosmetics, Germany, 2016.
₄₅ Chemical and Veterinary Investigation Office Münsterland-Emscher-Lippe: Investigation of microplastics in food and cosmetics (as of: 15.01.2018). https://www.cvua-mel.de/index.php/aktuell/138-untersuchung-von-mikroplastik-in-lebensmitteln-und-kosmetika. [23.10.2019].
₄₆ Tyree, C., Morrison, D.; Orbmedia: Invisibles - The Plastic inside us. https://orbmedia.org/stories/Invisibles_plastics.[23.10.2019].
₄₇ https://biooekonomie.de/studie-2017-plastikproduktion-und-verbrauch-weltweit
₄₈ Westdeutscher Rundfunk Köln: Will there really soon be more plastic than fish in the sea? (as of 13.03.2019). https://www.quarks.de/umwelt/muell/plastikmuell-mehr-plastik-als-fisch-im-meer. [23.10.2019].
₄₉ UNEP (2018): SINGLE-USE PLASTICS - A Roadmap for Sustainability, https://wedocs.unep.org/bitstream/handle/20.500.11822/25496/singleUsePlastic_sustainability.pdf, p.13.
₅₀ BUND (2019): Plastic Atlas 2019 - Facts and figures about a world full of plastic, 2nd edition, July 2019, p.9.
₅₁ The Guardian (2016): From oil use to ocean pollution: five facts about the plastics industry. https://www.theguardian.com/sustainable-business/2016/jan/20/from-oil-use-to-ocean-pollution-five-facts-about-the-plastics-industry. [22.10.2019].
₅₂ Bayerischer Rundfunk: Fischfang verursacht jährlich 640.000 Tonnen Plastikmüll im Meer (Stand: 07.11.2019), https://t1p.de/b9nv. [23.04.2021].
₅₃ Lebreton, L., Slat, B., Ferrari, F. et al. Evidence that the Great Pacific Garbage Patch is rapidly accumulating plastic. Sci Rep 8, 4666 (2018). https://doi.org/10.1038/s41598-018-22939-w.


Dear Conservationists,
You are absolutely right: we are facing a waste catastrophe. Not only in the oceans. To avoid it, political regulations must be made, especially in Europe. Especially in Southern Europe - Greece, Italy (Sicily) etc. nature and the sea have been deliberately abused as a garbage dump for decades. The reason e.g. for garbage on land and in the sea, especially plastic and glass bottles: No take-back system, no recycling, no garbage collection, and a disastrous attitude towards the environment. There is a clear North-South divide in this problem, although there are enough environmental sows here who throw their garbage into the forest. For the main polluters, the Mediterranean countries, only strict EU rules and regulations remain. E.g. recycling or take-back regulations! But: Who knows these countries, knows around their life world and purchase culture. There are hardly any supermarkets like ALDI etc., but more small stores, which cannot cope with such procedures. In the south of Europe and in large parts of the world, there is no take-back procedure for plastic bottles etc. anywhere. As long as nothing is regulated there we don't need to think about the rest of the world and the oceans for a second. Unfortunately! With well-meant appeals and actions we Central Europeans do not get any further. A few garbage collection ships or engaged activists do not advance also with many donations. The lever lies first with (European) politics. Where are our GREENS in Europe?
Greetings
Hi Fritz, thank you for your detailed comment 🙂 .
You are absolutely right. I hope that politicians wake up. We can only do our homework and adapt our habits, live more plastic-free and reduce waste as much as possible. Due to the change in demand, politicians and companies must also follow suit. Of course, I would like to see politicians take this step immediately, because fees, taxes and penalties can quickly change people's minds.
Best regards
Christoph
Certainly in Europe there is also potential for improvement. The megacities in Africa produce huge amounts of waste and practically nothing is burned or recycled there. I think the Europeans are already quite progressive.
Hi Dominik! We are definitely progressive, however, so far masses of plastic waste have also been shipped to China because we are no longer in control of the situation. Now Germany is facing a big challenge because of all the plastic waste and I hope that a general rethinking will take place.
But it doesn't matter where the garbage comes from, because in the end we all eat the fish that have microplastics in their cells.
Many greetings,
Christoph
Is plastic waste that is not recycled dumped into the sea in Germany?
Hi Blck! What do you mean? Whether the portion of garbage that is not recycled ends up in the ocean? A large part ends up in the environment and then sooner or later also in the sea, exactly.
Just read a new article about the Garbage whirlpool in the sea published, take a look at it.
Love greetings
Christoph
Christoph,
What "Blck" meant (and I think you understood) is that plastic waste that accumulates in Germany is incinerated or recycled. Nothing ends up in the sea. If only because it makes no economic sense.
So it brings zero point zero nothing in Germany to drive the tax burden for the average citizen into the immeasurable, as a punishment for the fact that third world countries dispose of their waste in the oceans.
This is blind actionism and only plays into the hands of politicians, who are lining their pockets with the ignorance and credulity of the people.
Hi Timo! Thanks for your comment. There is no need to increase the tax burden either, who says? It's more about bans on unnecessary plastic, such as plastic bags. This should also be introduced not only in Germany, but worldwide. Currently, the first cities and countries are starting to do this.
Greeting Christoph
Pingback: So little plastic is really recycled ??! - plastic isnt fantastic
hi alex! 😉
Dear CHristoph,
May I ask where you got this figure from and in what volume (million, billion or per capita?) Unfortunately, I can't find anything about it in the current (stated statics).
Thank you
"At 11.7 tons, Germany consumes more plastic than any other country in Europe. (Plastic waste statistics 2016)"
Hi Lina, the value comes from a separate statistic called "The Plastic Age" - however, I can't provide you with a download link right now, but will do another search.
Many greetings
Christoph
Many greetings, Christoph
Hello Christoph,
Thank you very much for this article. I would be interested in the direct links to the plastic waste statistics 2016 and 2017. I always find the context quite interesting.
Thank you for your time and help,
Manuela
Hi Manuela, thanks for your comment! Many of the facts are taken from the Ellen MacArthur Foundation study "The New Plastics Economy"->. https://www.ellenmacarthurfoundation.org/publications/the-new-plastics-economy-rethinking-the-future-of-plastics
I hope I was able to help you further and wish that this year many more studies on the topic of Plastic waste in the environment be brought out.
Many greetings,
Christoph
Here is a link to the numbers from the federal Environmental Protection Agency.
https://www.umweltbundesamt.de/presse/pressemitteilungen/verpackungsverbrauch-in-deutschland-weiterhin-sehr
Of the ~220 kg of packaging waste per capita in Germany, ~25 kg is plastic waste. The largest part is paper and cardboard.
Both sides do not exist !
Hello dear Santa Claus,
which pages are we talking about exactly?
Many greetings
Christoph
Hello Christoph,
I am new to the blogging/less waste world - but better late than never 🙂
I have linked your blog with me and would be happy if you ever stop by.
Have a nice weekend you!
Many greetings from Frankfurt,
Laura
Hi Laura! A great site you have put on the legs 🙂
Thanks for your feedback and let's make a difference together!
Many greetings,
Christoph
Are there concrete, valid figures in terms of:
How many plastic BAGS from Germany end up in the sea?
How do 1x used plastic bags compare to 1x used paper bags when incinerated after use?
Are there any serious studies that prove that and how exemplary German behavior changes the attitudes of the Third World? World change?
Sincerely
Hi Hanns,
Unfortunately, I do not have any figures on this, as the cases are very specific.
We only change something in third world countries if we go into direct exchange with each other.
We have to pass on our knowledge so that no time is lost there.
Stay clean,
Christoph
For the 11.7t plastic waste (see above) the unit million is missing.
According to the Federal Environment Agency, however, this should amount to 6 million tons of plastic...
You are absolutely right that far too much plastic is consumed and not dealt with sustainably (>recycling rate). But the units have to be right...
https://www.umweltbundesamt.de/daten/ressourcen-abfall/verwertung-entsorgung-ausgewaehlter-abfallarten/kunststoffabfaelle#textpart-2
Hi Max and thanks for your tips! Is already adjusted.
Everyone must look at their own nose, consumer, manufacturer, large corporation, politics.
If we stop buying the plastic crap, manufacturers will gradually understand that, too. But we have no time to lose.
Love greetings
Christoph
Dear Christoph,
We find this website very informative and would be very happy about further contributions.
Hi Hans Frans 😉
Thank you, you can expect the same!
Best regards,
Christoph
Hello Christoph,
I somehow don't quite understand why I should reduce my plastic consumption for the environment if I dispose of the plastic normally in the trash. Apparently, almost everything in Germany is either incinerated or recycled and almost nothing ends up in landfills. It is clear to me that more plastic should be recycled and I am also aware of the plastic problem in the world, but Germany is actually rather a role model for other countries in terms of recycling, or not?
I would be very happy to receive a reply 🙂
Kind regards,
Sarih
Hi Sarih, thanks for your comment.
Plastic consists of petroleum or raw gasoline, a limited raw material. Even though our recycling rate is high, too much is burned -> which means that the limited raw material is being destroyed here. Even if we have a high recycling rate in comparison, that doesn't mean we should rest on it. Because the rate is still lousy.
In Germany, too, we have a lot of Plastic waste in the environmentespecially microplastics.
And isn't it a cool feeling when you manage to consume in an environmentally conscious way, so that you don't produce 10 bags of plastic waste every month 🙂 Feel free to check out the article Zero Waste Lifestyle an.
I look forward to your next comment and have a great evening.
Stay clean,
Christoph
You've already read the article, right?
Most of the plastic waste in Germany is exported (for recycling, but it is not proven that this happens according to the German / European guidelines).
It is very cynical to talk about recycling plastic in developing countries when we export most of our plastic waste to these countries. Everybody should recycle / dispose of his own garbage, but you can't earn money with it, so it is shipped around the world (which consumes fuel again).
The best way to deal with the problem is to reduce plastic production and consumption from the outset.
This is an extremely complex topic, because in the end there is also an energy balance to be seen: much of what is produced from plastic today was produced from other materials in the past, which requires significantly more energy (e.g. steel, aluminum, glass). Such value stream analyses can hardly be reduced to a few simple and striking sentences...
But I also always go shopping with folding box / net bags and basket, our consumption of plastic bags is about 2 bags per year for a family of four. Nevertheless, much more could be done, of course.
good that you sic for it
Thanks Martin 🙂
Hi Christoph,
I think it is very good that you are getting involved in this matter. I am also very professionally involved with the topic of recycling, bioplastics and the entire waste problem.
I work in a company that manufactures plastic packaging. We are very confronted with the fact that, due to the increasingly (rightly) prominent discussion about plastic waste, our business customers are cautious about the topic of plastic.
But what I always notice is that the focus of the discussions misses the point or at least doesn't get to the heart of the matter. You also write in your blog about the plastic components of our cosmetics. This has been under discussion for several years now and is certainly not absolutely necessary.
However, this (unnecessary) share of microplastic is vanishingly small compared to other sources of microplastic. By far the largest share of microplastics is generated, for example, by tire abrasion in vehicles; even the abrasion of synthetic fibers in textile washing is assumed to be 4 times higher in a study by the Fraunhofer Institute UMSICHT.
Likewise, the Helmholtz Centre for Environmental Research in Leipzig, Germany, in a study, named only 10 rivers worldwide as the cause of 90% of all waste in the oceans.
Everyone can find a way to live more sustainably for themselves. However, we can only get to grips with the real problem if we achieve a change in thinking worldwide. And that, of course, is a very difficult undertaking.
Keep up the good work with your site, I like it.
Kind regards, Michael
Hello Michael! Thank you for your objective comment. I also always try to see both sides. Regarding the microplastic problem, I know of course that cosmetics are only a fraction of what tire abrasion does. However, I also see that we are putting these plastic cosmetics on our faces or rubbing them on our bodies - very concerning for our health, no matter in what quantities.
That's right, we have to act globally - together. I do my best to accompany people for the topic. Let's keep it up and keep making a difference. Even if it feels like progress is slow, we're getting closer to the goal.
Stay clean,
Christoph
Hello, great that I found your site. It is really scary that the most intelligent species on this planet is slowly but surely abolishing itself. We need to get into the heads of people to show that it can be done differently.
I have reoriented myself professionally and offer the optical retail sun and correction glasses from marine plastic waste and used fishing nets. For this purpose, we collect up to 1 ton of plastic waste on beaches in Spain every day. The local fishermen support us and bring the garbage from their nets ashore as well. Please support our small company.
Hi Dirk! I think that's great, thanks for your comment. Maybe you should team up with Pure Clean Earth in Barcelona, they also collect trash almost every day. Come gladly in our Global Beach CleanUp Group for more support.
Greeting Christoph
Hello,
thank you for the interesting page. I have been very interested in plastic avoidance for some time and am trying to change my behavior. Unfortunately, we in Germany can hardly change anything directly in the littering of the world's oceans, except to set a good example. The main polluters are not the Europeans or the USA but mainly China, Indonesia, the Philippines, Vietnam and Thailand. As far as I know, the reason for this is a non-functioning waste disposal or free storage of waste, whereby the plastic is carried into the sea by the wind. I.e. not that we should continue as before, but these facts must unfortunately be taken note of. So we cannot solve the problem alone or not at all.
Hi Hannes, thanks for your comment. We can solve it, but only together. You are right that "dumping" of garbage is a very big problem. We need to share our knowledge about modern recycling methods and how to deal with plastic to all countries. I look forward to hearing from you again.
Stay clean,
Christoph
Hello Christoph,
Your efforts are exactly right and I also think it's good that you want to educate people about this. I am currently writing a thesis on the subject of recycling and came across this page. Basically, I think your work is good, but you should be more precise with facts and figures. Can you forward me the sources for the "plastic waste statistics 2017 and 2016"? I would like to use the numbers, but I need a reliable source. Unfortunately, I could not find anything under the given source for 1) either.
Love greetings
Philipp
Philipp, the figures were not always based on sources and studies - some values come from articles in Die Zeit or the FAZ, where they were used without citing a source. If there is no source here, I can't help you at the moment. However, I constantly search the latest studies and update this article with well-founded statistics on the topic of plastic waste.
Best regards
Christoph
Hey Christoph,
I am currently researching for my own plastic-related project and came across your super interesting article! In this train I have a question right away. You write that the first plastic product came on the market in 1950. Do you know what exactly that was?
Would really appreciate some info 🙂
Many greetings,
Désirée
Hi Désirée!
Large-scale PVC production, for example, began as early as 1938. Before that, there were a number of discoveries and developments dating back to the 19th century. Just do a search for the history of plastics. (you've given me another new article idea, thanks! 😉 )
Many greetings
Christoph
Hey Christoph,
top, thanks for the tip!
Then I'm curious what you write about the history of plastic ?
If you're curious to see how your idea turns out, feel free to check out the website of me and my team, which I've included below ?
Many greetings,
Désirée
By how many tons does the production of plastic increase annually?
Hi there. Here is a graph that will help you, because it shows the course from 1950 to 2013: https://www.businessinsider.de/studie-zeigt-produktion-von-plastik-hat-dramatisch-zugenommen-2017-7
Best regards,
Christoph
You want to fight plastic and then an e-book (made of plastic) is given away at the top right?
How about doing that for a donation at least?
Hi Dirk! This is a PDF file, which comes 100% plastic-free per email to you 😉
Best regards,
Christoph
Dear Christoph,
Unfortunately, the button for the itemizations does not work.
However, I would be very interested in the individual sources.
Would it be possible to get the footnotes?
Dear thanks, Lena
Hi Lena! It works for me. Where do the proofs not open? On mobile, desktop and with which browser? Try it alternatively with another browser.
Thanks for your feedback!
Many greetings
Christoph
Thanks - it was indeed the Chrome browser. With Internet Explorer, the footnotes were viewable without a problem. Thanks for the great summary of the data.
Thanks for your feedback! Always gladly!
Many greetings
Christoph
we have soon a presentation on the subject, and have found a lot of useful information on your site. thank you for it. lg Annika and Julia from the Baltic Sea
Hi you two! Thanks for the great feedback on the post. I hope you were able to make many people aware of the plastic waste problem.
Best regards to the sea,
Christoph
Thank you for this great website.
I'm giving a presentation for an international seminar soon and the facts and figures I could find here are very helpful for that!
Hi Jo! Thank you for your feedback and good luck!
Best regards
Christoph
I found the text on the subject of plastic very interesting and am just about to get completely away from plastic. As you know it but you still have old Tupperware and plastic bowls. I am looking for my plastic stuff sustainable to dispose of or that maybe someone can still do something sustainable with it. Can you help me there?
Hey Kathi! Look at the post live plastic freen. There you'll find out everything you need to know about making your everyday life as plastic-free as possible. Try giving the Tupperware to neighbors, clubs, or food banks - or sell them on eBay Classifieds.
Best regards
Christoph
simply not drauf reagiren wär keine Lösung wies noch nicht mal ob ich jetzt noch Kinder kriegen möchte bei so einer Zukunft .kannst du tippst geben wie man plastik sparen kann(;
Hey Josi! Right!
Look in the post about the plastic free lifestyle. You'll get countless tips there.
Best regards
Christoph